Spotting implausible growth assumptions in US large-caps
We’ve been thinking deeply about our public equities allocation over the past few months. One big consideration is that our time horizon is longer than that of almost all individual and most institutional investors.
Because of our extremely long time horizon, risks like volatility and tracking error (even over long periods) become less important, while risks around valuation multiples, business fundamentals, and high-impact tail risks regarding geopolitics and economics become more important.
Our initial area of focus was valuations, particularly in US large-caps. Since we know that starting valuations are important for long-term returns, we wanted to find a way to grasp the reasonableness of these valuations.
Using implied earnings growth to test whether valuations are reasonable
One approach we have seen is to create a model for how a given company’s financials will evolve over time, with that model’s assumptions culminating in a single target price that is then compared to the current price. However, we find two problems with this approach: (a) every assumption is a positive bet on something happening in order for our valuation to be valid, and (b) it would be very difficult to do this at scale for even the 500 stocks in the S&P 500.
We decided instead to focus on what current market prices imply about how companies’ earnings will grow, and then make a negative bet on what seems unreasonable.
Using a two-stage earnings growth model with a 2% terminal growth rate after 10 years, we can plot the combination of discount rate and implied growth rate for a range of P/E values:
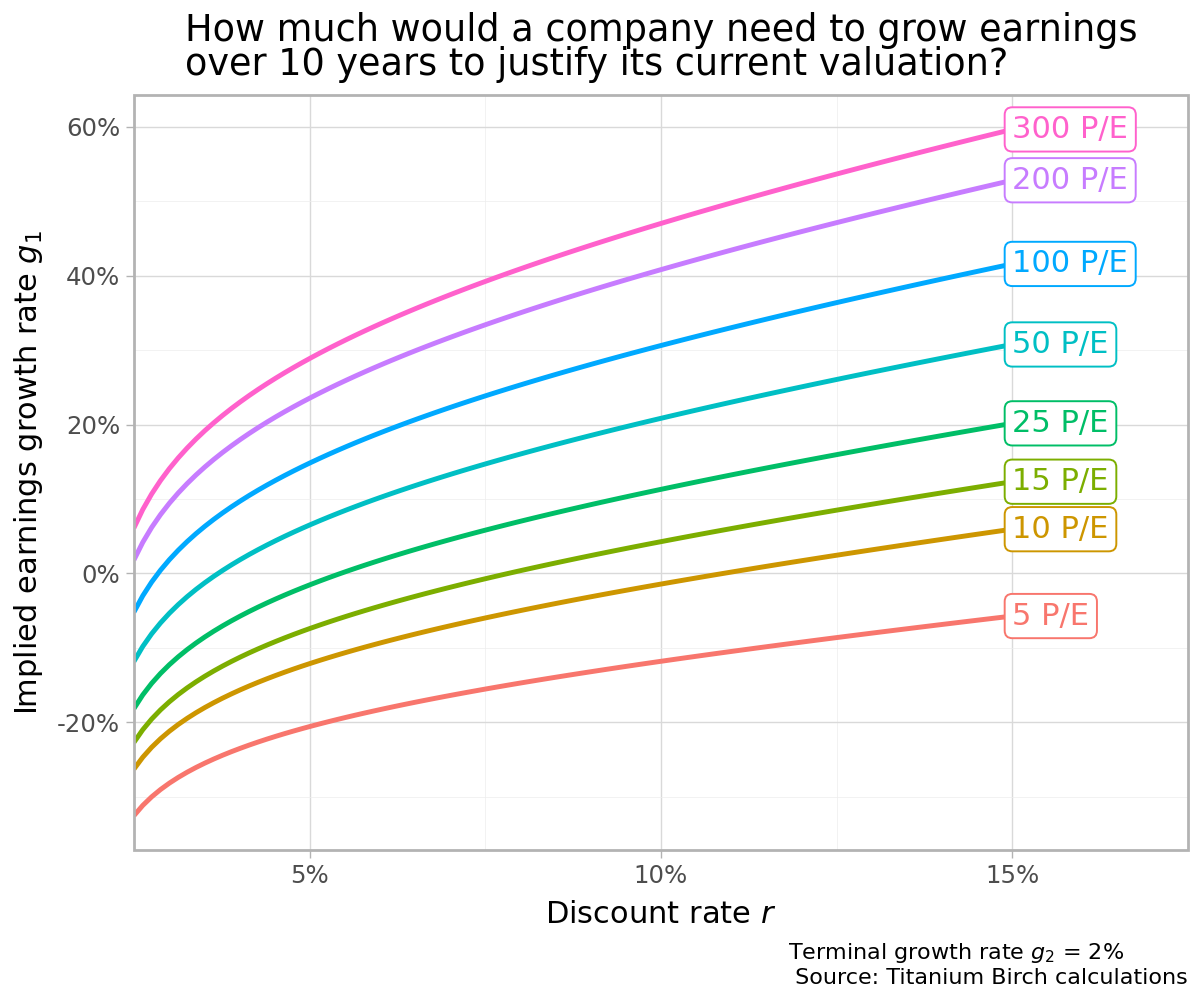
Assuming a discount rate of 10%, as the P/E ratio increases, the required earnings growth rate over 10 years rises from -10% annually at 5 P/E to almost 50% annually at 300 P/E.
An example
To illustrate with an example, consider Palantir Technologies (PLTR), trading at a trailing P/E of 374.08 as of 2025-11-25. We use a discount rate of 9.96% for a Software (System & Application) company in the United States, provided by Professor Damodaran.
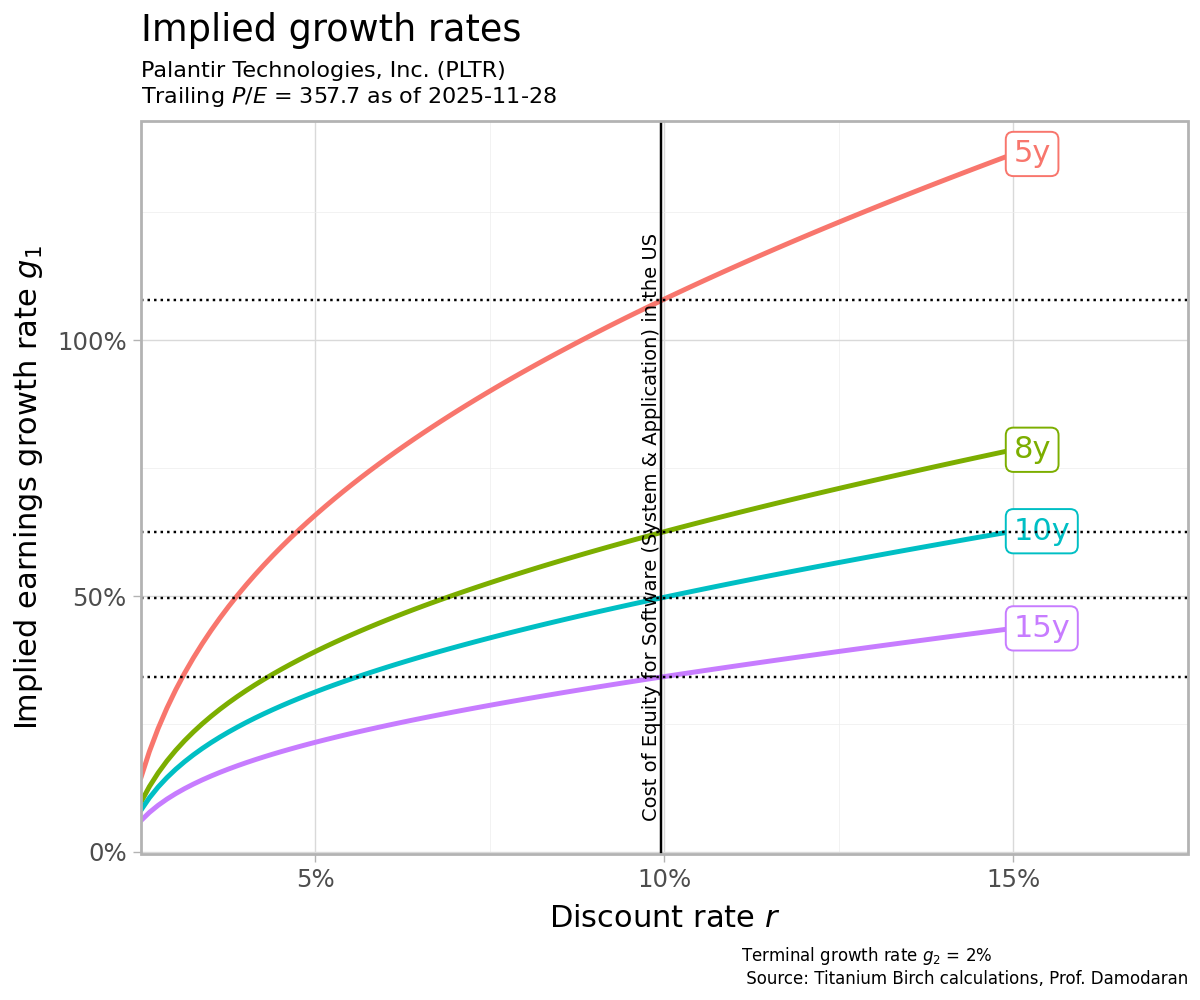
Based on the above calculations, we can then evaluate whether it is feasible that Palantir can grow at ~110% for 5 years, ~60% for 8 years, ~50% for 10 years, or ~40% for 15 years.
The actual answer to whether it’s feasible is more nuanced and complex. We imagine using methods such as:
Historical earnings growth in the same lifecycle stage: is this typical for how a company grows, or is this unprecedented?
Physical and market limits: is this earnings growth even possible for the markets the company serves, or markets it intends to expand into? Some firms would need every person on the planet to be a customer in order to reach those levels of earnings growth.
Model consistency: Backing out earnings growth to a more detailed DCF model, do all of the assumptions make sense, and are they internally consistent?
We feel like this is a lot more tractable, because we’re simply trying to find implausible assumptions, rather than trying to determine exactly what the future will hold.
Some US large-cap earnings growth rates seem implausible
Applying this logic to companies in the S&P 500 (excluding companies with negative earnings), we can pick out a few that fall in the category of “already big, and expected to grow even bigger”. This is the set of companies for which we exercise a fair bit of skepticism about their valuations.
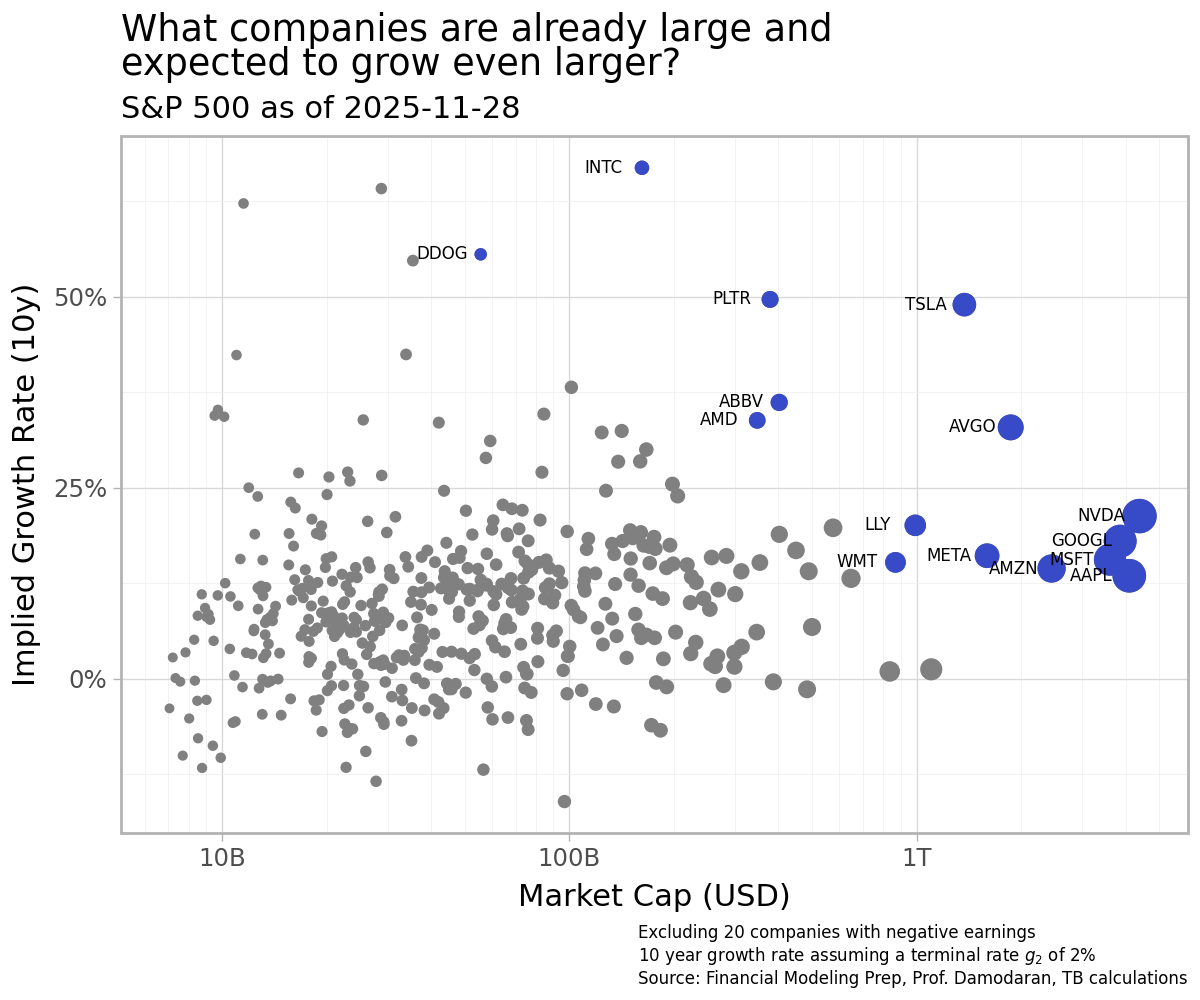
For example, at an implied growth rate of 50%, Tesla Inc. (TSLA) would need to earn 170 times its current annual earnings in the next 10 years in order to justify its valuation. Whether it's possible for Tesla to achieve such earnings through its current or potential business lines is a complex question, but I think many might agree that when so much of the company’s value is in the future rather than provable through historical execution, that might deserve some pause.
How this shapes our portfolio
If we determine it’s unlikely for a given company to ever grow its earnings at the rate expected by the market, we reduce our allocation to that company beyond our model portfolio weights. It’s not to say that none of these companies will ever be able to grow as implied, just that on average it’s more unlikely than likely. While this might cause us to lag the index in the short run, we believe it will improve our returns over the very long term.
This is just one part of how we’re implementing our public equity strategy. In the coming months, we’ll share more about how we tilt our portfolios and decide between using ETFs and single stocks.
We’re hiring an Investment Systems Engineer to turbocharge our efforts in this problem space (and others). If you know someone who might be a good fit, please send them this job posting.
A shoutout to Financial Modeling Prep (FMP)
Our analyses on public equities so far are fueled by data from Financial Modeling Prep. We like FMP as a data provider for their global coverage of individual equities and ETFs, reasonable data quality, easy-to-use API endpoints, and reasonable price point.
Disclaimer: This content is for informational purposes only and is not investment advice or an offer or solicitation for any investment product.